SET ANALYSIS is a QlikView feature which provides you to pre-define the SET OF DATA that charts / tables uses. Set Expression is a function which can tell you how the chart / table to display values corresponding to various sets of data (pre-defined time-period, geographic region, product lines etc.).
Set analysis offers a way of defining a set (or group) of data values that is different from the normal set defined by the current selections. When we make selections on certain variables and the changes reflect in the entire application. This happens because through our selection, we have created a set of data which we want to use. In a similar fashion, using Set Analysis feature, we can pre-define the data to be displayed in our charts.
Set analysis Characteristics
- Set Analysis is used to create different selection compared to the current application selections• Set Analysis is used to create different selection compared to the current application selections
- Must be used in aggregation functions, such as Sum, Max, Min, Avg, and Count aggregate over the selections that you have made: the current selections.
Set Analysis vs Set Expression
Defining a set of field values is referred to as defining a set expression, whereas using set expressions to analyze data is referred to as set analysis.
Data Set:
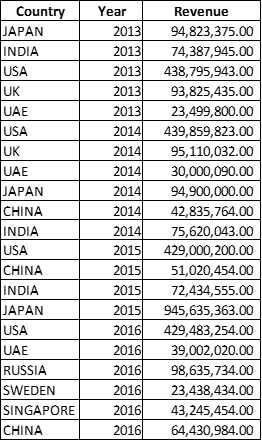
Example for set Analysis: sum( {$<Year={2014}>} Revenue ), in which {$<Year={2014}>} is a set expression.
There are two general syntax rules for a set expression:
- A set expression must be used in an aggregation function. In this example, the aggregation function is Sum(Revenue)
- A set expression must be enclosed by braces, {}. In the example, the set expression is: {$<Year={2014}>}
A set expression consists of a combination of the following parts:
Identifiers. One or more identifiers define the relationship between the set expression and what is being evaluated in the rest of the expression. A simple set expression consists of a single identifier, such as the dollar sign, {$}, which means all records in the current selection.
Operators. If there is more than one identifier, an operator or operators are used to refine the set of data by specifying how the sets of data represented by the identifiers are combined to create a subset or superset, for example.
Modifiers. A modifier or modifiers can be added to the set expression to change the selection. A modifier can be used on its own or to modify an identifier to filter the data set.
Set Analysis – Syntax

Note: Set expressions can only be used in expressions for charts, not in script expressions.
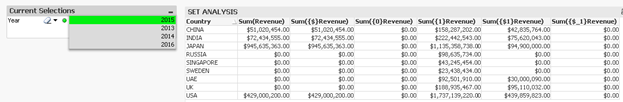
Identifiers:
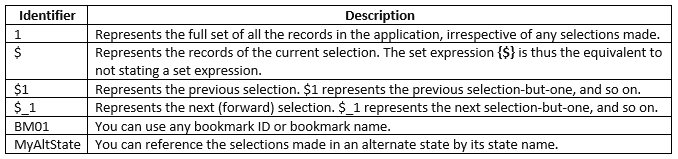
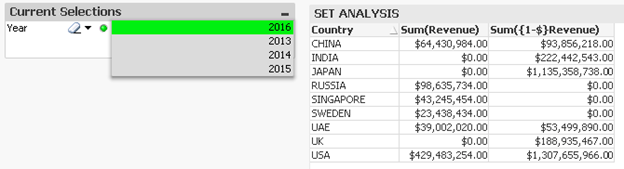
Below example, Selection done on Year 2015 and previous selection was 2014.
Operators:
Operators are used to include, exclude, or intersect parts of or whole data sets. All operators use sets as operands and return a set as result.
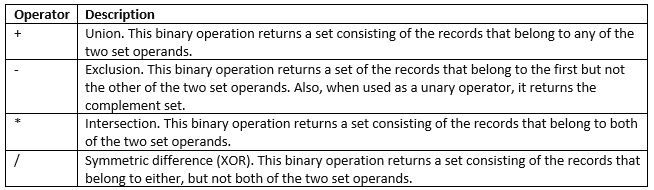
Example, “Sum({1-$}Revenue)” – Returns total revenue excluding current selection.
Modifier:
Modifiers are used to make additions or changes to a selection. Such modifications can be written in the set expression. A modifier consists of one or several field names, each followed by one or several selections that can be made in the field. Modifiers begin and end with angle brackets, <>.
A set modifier modifies the selection of the preceding set identifier. If no set identifier is referenced, the current selection state is implicit.
Example:
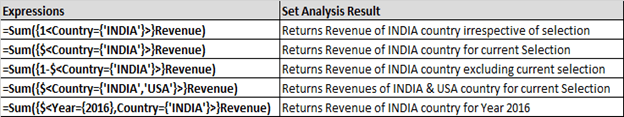
=sum({$<Country={‘INDIA’}>}Revenue)

We can compare the revenue for last two years based on your current selection. Example, if you want to compare year 2014 & 2015, then your current selection would be 2015.

SET Analysis Functions – P() & E():
Function P() is used to identify the values within the fields and E() will exclude the values within the field.
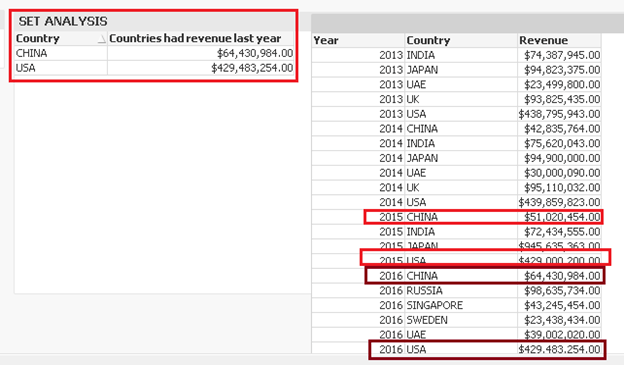
To find out which are all the countries had revues on last year (as per our data set last year is 2016 and previous year is 2015), Function P used to find out the countries and only CHINA & USA had revues in 2015.
=sum({<Year={$(=Max(Year))},Country=P({<Year={$(=Max(Year)-1)}>}Country)>}Revenue)
I have summarized almost all the possible examples of Qlikview SET ANALYSIS functions & features where you can build a powerful dashboards to do quick decisions on the day to day business. Please feel free to post your comments.
