Problem Description:
Daily transactions are loaded into database on daily basis along with Date. There is a requirement to schedule the reports on each and Every Quarter end and display the data for 3 separate tab for each month of the quarter and send it to users.
- Example -1, Refresh the report on April 01, and get the data into the report for January, February and March as a separate tabs.
- Example -2, Refresh the report on July 01, and get the data into the report for April, May and June as separate tabs.
Solution / Analysis:
Step1: Create below mentioned Objects in Universe.
- Starting Date (Select the tables manually and object type as Date)
- add_months(trunc(to_date(@Prompt(‘Enter Quarter End Date(MM/DD/YYYY)’,’D’,’LOV\Calendar Date’,mono,free),’DD-MM-YYYY HH24:MI:SS’),’Q’),-3)
- End Date (Select the tables manually and object type as Date)
- trunc(to_date(@Prompt(‘Enter Quarter End Date(MM/DD/YYYY)’,’D’,’LOV\Calendar Date’,mono,free),’DD-MM-YYYY HH24:MI:SS’),’Q’)-1
Step2: Create below mentioned Conditional Object in Universe.
- Quarterly Date (Ex – April to June)
- Table1.CALENDAR_DT BETWEEN @Select(Schedule\Starting Date) AND @Select(Schedule\End Date)
— Used the above Starting Date and End Date object to get the range of data into the report.
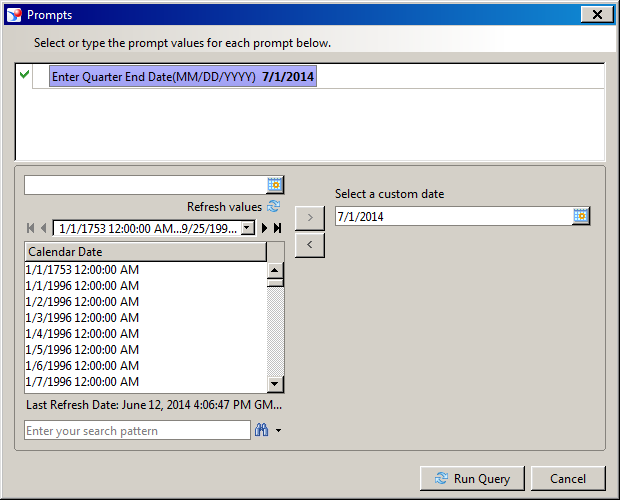
Step3: Add the above objects into your report along with other required objects and refresh by entering input.
Note: If you want the report for second quarter (April to June), input date would be any dates in JULY.
 Step4: Create below mentioned Variables in the reports.
- vMonth Number
- =MonthNumberOfYear([Calendar Date])
Tips : Above variable returns the values from 1 to 12 based on the your report input. Example, if you enter 01/July/2014, then above variable would return vales of 4(April), 5(May) and 6(June).
Step5: Develop your required report in one tab and apply the below filter. Make copy of the first tab into another two tabs. These filters are dynamic and it will filter the data based on your report prompt input values. To provide more details, I have explained with Second quarter data.
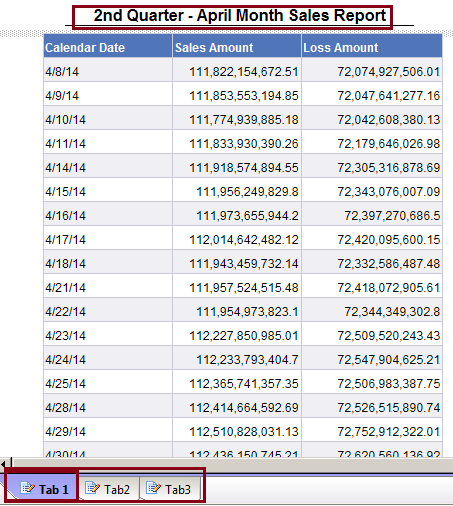
Tab 1 (example April Data):
Add vMonth Number variable in the filter section and define the filter where =<vMonth Number>. InList (1,4,7,10)
Tips: Above filter will restrict the first month data based on the input. If your input is July 1st 2014, then It will show only Month Number as 4 and same logic applies for all other quarters.
Tab 2 (example May Data):
Add vMonth Number variable in the filter section and define the filter where =<vMonth Number>. InList (2,5,8,11)
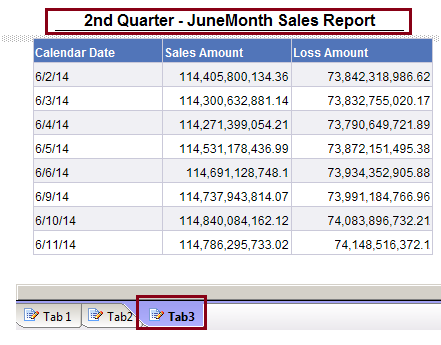
Tab 3 (example June Data):
Add vMonth Number variable in the filter section and define the filter where =<vMonth Number>. InList (3,6,9,12)
Sample report – Below is the sample report screen for 2nd Quarter report and each month will have separate tab
Tab1 – April Month Report
 Tab2 – May Month Report
 Tab3 – June Month Report

i want a web intelligence functions. all documentions on webi functions.plz sent to my mail
Hi,
You can get complete Web Intelligence functions in the below post.
https://dwbicastle.com/2013/12/30/web-intelligence-webi-report-functions-complete-overview/
Thanks
Madhes