This post will explain how Data visualization tools capability’s are differ from one tool to another along with their architecture at high level.
SAP BI Dashboard (Xcelsius) – Capabilities
- Scalability improvements allow dashboards to reach the masses. Dashboards will now scale in a linear fashion.
- With BI 4.0 large scale, possible enterprise wide dashboard solution for operational employees.
- Dashboard will be multi-lingual, that involves translated static text using translation manager and number formatting.
- Dashboards product has been simplified so that Excel can be bypassed.
- Integrates the next generation universe.
- New universe object browser that will enable to link directly universe query result objects to visualization without the need to use the Excel spreadsheet.
- Query panel in Dashboards Designer.
- Direct binding of Universe objects to visualizations.
- Prompt selector to leverage prompt defined in Universe.
- Separation of roles between data experts and dashboard authors.
- Consistent access to data between clients and across sources.
- One abstraction layer for all data sources.
- Support of BW & third part OLAP-based Universe.
SAP BI Dashboard (Xcelsius) – Sample Screen
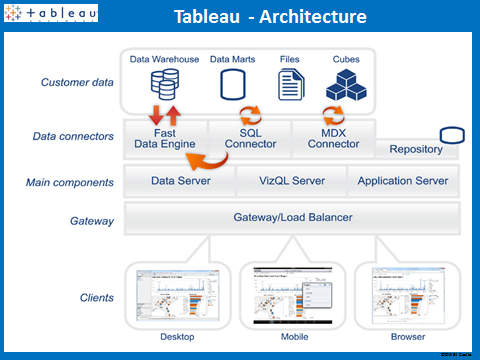
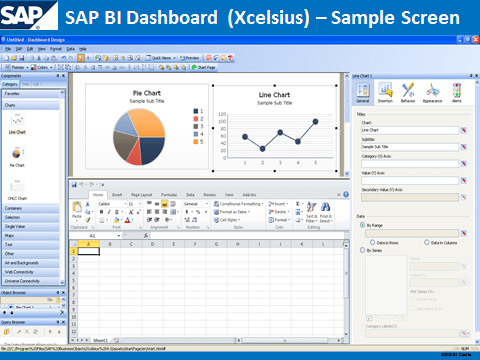 Tableau – Capabilities

- Web-based analytics in minutes, not days.
- Multi-dimensional insights into your business.
- Geographic visibility with one-click analytical map creation.
- In-memory data engine makes your slow databases and files super speedy.
- Compelling presentations for internal and external meetings.
- Collaboration and sharing through web deployment.
- Embedded interactive visualizations into applications.
- Plugs into your existing IT infrastructure — fast and easy.
- deployment, low maintenance, low total cost of ownership.
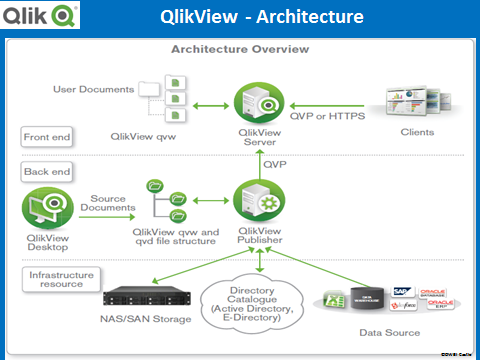
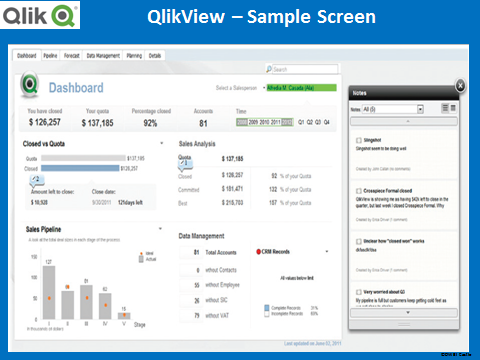
 QlikView – Capabilities

- Advanced Excel transformations. Allows quick prep of Excel data. E.g. filling in merged cells.
- AND/NOT selections (as opposed to OR).
- Semantic model support.
- Define relationship and inverse relationship. E.g. locale all predecessors and successors.
- Collaborative BI. Similar to two-way desktop sharing or Google Docs sharing.
- Can be done through web browser with no client plug-in required.
- Client-side data access.
- Can access and analyze Google Analytics data via client browser, simplifying security.
- Metadata can be imported and linked to attributes.
- Use of an in-memory data model .
- Allows instant, in memory, manipulation of massive datasets .
- Does not require high cost hardware.
- Automated data integration and a graphical analytical environment attractive for customers
- Fast and powerful visualization capabilities.
- Ease of use – end users require almost no training.
- Highly scalable – near instant response time on very huge data volumes.
- Fast implementation – customers are live in less than one month, and most in a week.
- Flexible – allows unlimited dimensions and measures and can be modified in seconds.
- Integrated – all in one solution : dashboards, power analysis and simply reporting on a single architecture.
- Low cost – shorter implementations result in cost saving and fast return on investment.
- Risk free – available as a fully-functional free trial download.
This post has high level Dashboard tool capability comparison and its prepared for one of our client presentation and just want to share here. Please post your comments.
